| Moving Averages |
| One method of calculating the average value of a stocks price is called a ¡°Moving average¡±. The moving average of a stock is calculated using a mathematical analysis of the stocks average value over predetermined period of time. Since the stock price changes over time, its average price also moves up or down correspondingly. The closing price is usually used in the mathematical analysis because it is the most price of the day.
It is easier to see and picture price movements by using a moving average. It can be used by itself or as a basis for other quantitative tools. A significant number of traders use the moving average as a tool of analysis.
Interpretation :
The most popular method of interpreting a moving average is to compare the relationship between the moving averages of the share price with the share price itself. Moving average gives trading signals as follows:
1) A buy signal is generated when the price crossed above the MA line.
 <![endif]--> <![endif]-->
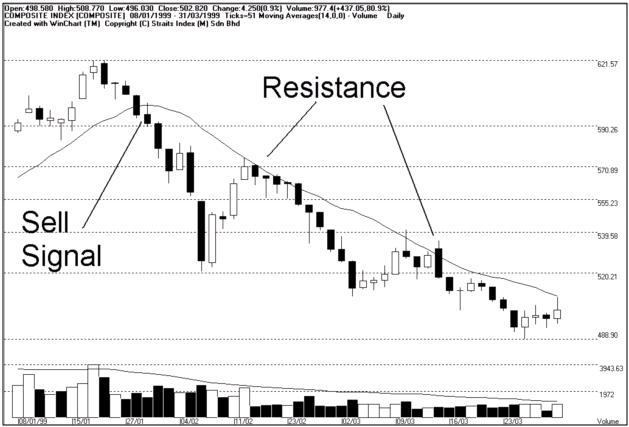
b) A SELL signal is generated when the shares price falls below its moving average.
c) When prices and MA are on the up trend, if prices suddenly increase in a very fast rate and far apart from MA indicates over bought. Share price may falls toward MA, this is a short term selling signal.
d) When prices and MA are on the down trend, if prices suddenly decline in a very fast rate and far apart from MA indicates over sold. Share price may move upward to MA, this is a short term buying signal.
e) When MA forms a side way after a up trend and prices start falls, if the prices fall bellow the supporting MA, this is a selling signal.
f) When MA forms a side way after a down trend and prices start increase, if the prices above the resisting MA, this is a buying signal.
 <![endif]--> <![endif]-->
g) When prices and MA forms a side way (line formation/rectangular), this indicates the market is uncertain. Investor should not buy or sell at this moment until MA shows a confirmed buying or selling signal.

h) Prices tend to have a "Pull-back effect" around MA. This effect will pull the prices back to MA if the prices moved away from MA significantly. Some time prices may falls below the upward MA and this is usually corrected by the pull-back effect this a very short period of time. In contras, the pull-back may occur when the prices break the downward MA and cause the prices to move back to the down trend. Investor should be careful with this false buy or sell signal, and should always use other indicators to filter this kind of false signal.
i) Upward MA is acting like the supporting line. During the correction of a upward trend, if prices touch the MA line, it should rebound on this MA. This rebound is usually a buying signal.
j) Downward MA is acting like the resistance line. During the correction of a downward trend, if prices touch the MA line, it should rebound from this MA. This rebound is usually a selling signal.
Multiple moving averages is generated by the combination of the short-term moving average, mid-term moving average and long-term moving average.
A. Golden cross :
- Buying warning occurs when the short-term moving average crosses above both the mid-term and long-term moving averages. - the Buying signal occurs when the mid-term moving average also crosses above the long-term moving average. 
B. Dead cross:
- Selling warning appears when the short-term moving average intersects downwards both the mid-term and long-term moving averages.
- Selling signal occurs when the mid-term moving average falls below the long-term moving average as well.
 |
Anugerah teristimewa. Cerita penuh warna. Harapan yang menyala agar masa depan yang bercahaya.
Wednesday, December 12, 2012
Buy signal for FELDA? Moving average said that?
Subscribe to:
Post Comments (Atom)
No comments:
Post a Comment